
Mixed Messages and Simpson's Paradox
Simpson's Paradox is an interesting, if confusing, phenomenon that often crops up when analysing big data sets and can be defined as "an association between a pair of variables can consistently be inverted in each subpopulation of a population when the population is partitioned".
For example, let's say as a business you have two ways of classifying sales: business or leisure. Now let us suppose that the business also has a simple value segmentation that scores customers as high or low value based on their total value to the business. To keep things simple let's assume there are 100 high value customers and 100 low value customers.
Comparing the average value of these customers to the business you might get something like this:
Fig1.
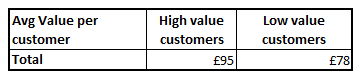
From this chart it can be clearly seen that high value customers are on average worth £17 more per customer than a low value customer. That's an impressive 22% in additional value!
Now, knowing how important high value customers are to the business it might be worth looking at where most of that value comes from. For example, do they like to spend more on business or leisure products? Looking at the average value of a customer for each type of sale might look something like this:
Fig2.
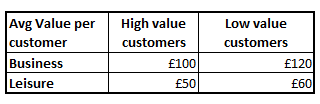
This result might look more surprising. It seems that Low Value customers are actually worth more per customer in each business unit yet we have already seen that as a group they are on average worth less overall! Surely something must have gone wrong?
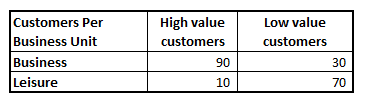
Actually no. This is an example of Simpson's Paradox at work. The trend seen at the total value level of high value customers being worth more seems to have reversed when we look at customer behaviour in individual business units. How is this possible? If we add in the customer numbers shopping in each business unit we can actually see how such a result can occur:
Fig3.
The answer to the riddle lies in the fact that the majority of High Value customers are business customers (which we can see from fig2. are worth more than Leisure customers). This means that the majority of High Value customers spend is in Business (a high value sales-type). Low Value customers on the other hand are mainly lower spending Leisure customers. This means that the majority of their total spend comes from a low spending sales-type.
If we write out the full equation to calculate each customer group's total value we can see how the result occurs:
High Value customers = (90x£100) + (10x£50) =£9,500 so an average value per customer of £95.
Low Value customers = (30x£120) + (70x£60) = £7,800 so an average value per customer of £78.
Simpson's Paradox can occur whenever aggregate totals are compared to sub-groups of the data. Both are useful and necessary ways to understand the subtle nuances of the results. For example as well as seeing that High Value customers are worth on average 22% more than Low Value customers to the business we can also see that they are a lot more likely to be business customers. However one needs to be aware of potential puzzle likes Simpson's Paradox when interpreting the data.
By Peter Smith, Analyst at Webalytix
PrivSec Conferences will bring together leading speakers and experts from privacy and security to deliver compelling content via solo presentations, panel discussions, debates, roundtables and workshops.
For more information on upcoming events, visit the website.
comments powered by Disqus